The 4 Stages of Agile Data Organization
By Dave Fowler on 10/23/21
The following is an excerpt of the Introduction chapter of the book The Informed Company. It introduces the 4 stages of data sophistication that the book walks through.
After working with thousands of companies, we recognized four distinct stages of agile data organization. Each of these stages has best practices and guidance on how to progress further “up the stack.”
This book maps on to these stages:
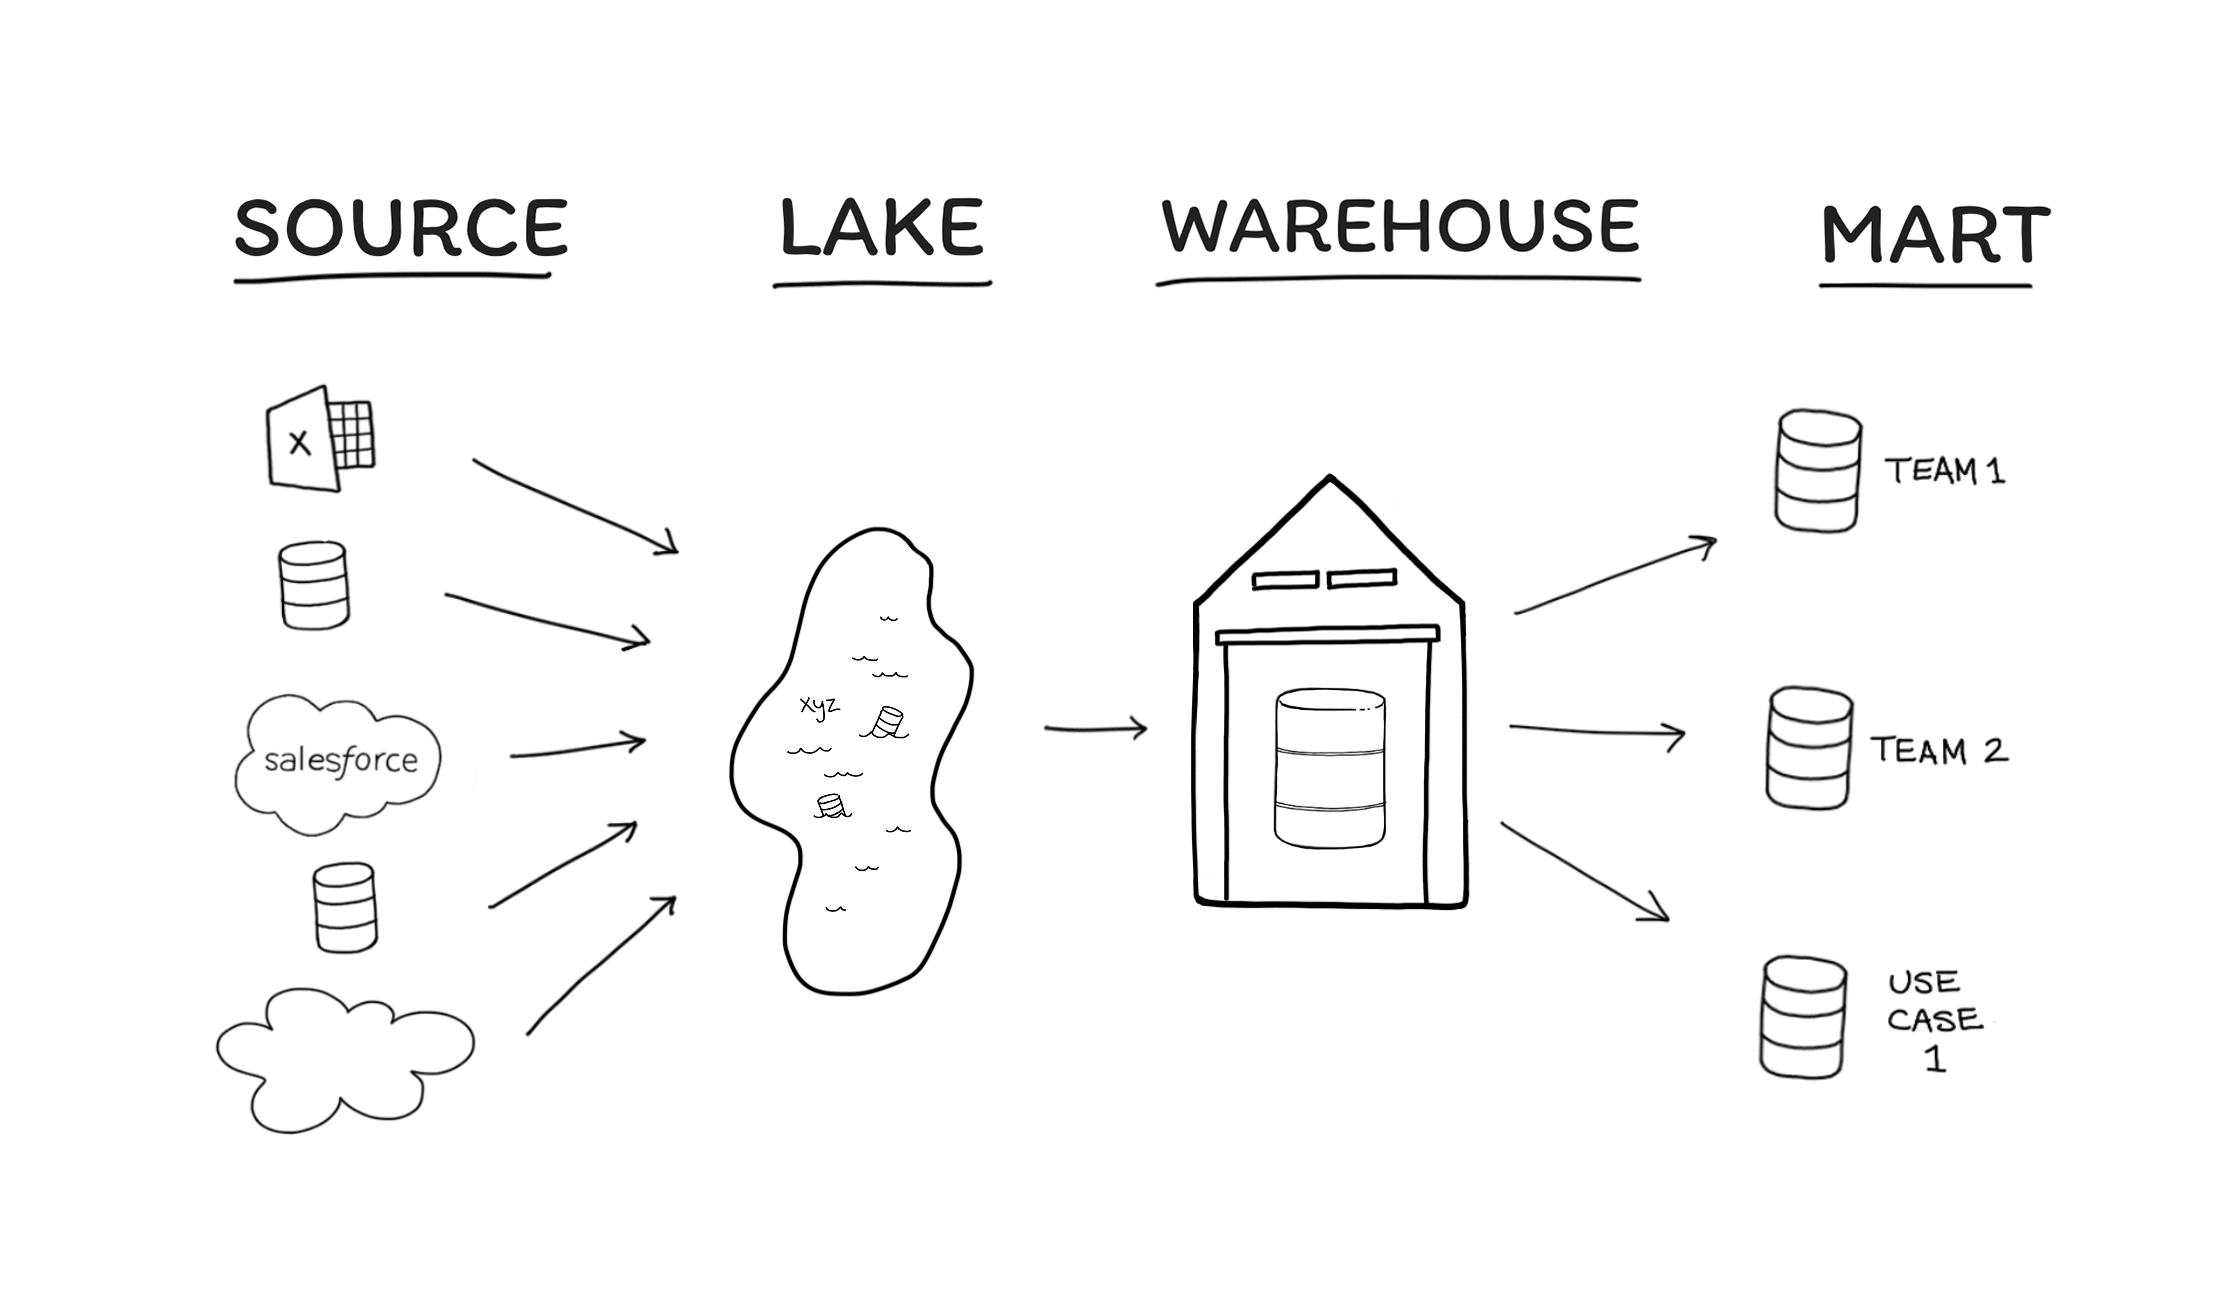
The 4 Stages of Agile Data Organization is a process that describes the lifecycle of data management.
Each vertical stage pictured could be what a company needs, depending on the resources, size, importance, and needs of data within an organization. Not every company needs all 4 stages. If a business gets the insights they need while in the source stage, then they should stay in the Source stage. Likewise, a company may find it needs a lake to combine all of its data together but may not need the transformations implied in later stages of warehouse development.
Let’s begin with an overview of each step.
Stage 1. Sources
Many teams only have a few data sources and commonly manipulate and visualize data in excel or google sheets. Two common just-starting-out sources are Google Analytics and “transactional” database(s), such as PostgreSQL or MySQL, that company products run on. If only a few people at a company need to work with data sources, it's possible to set them up with direct or replica access; it’s more agile and straightforward for them to work with the data directly.
We discuss how to configure proper access to data and how to lay the foundation for future organization into a single, unified collection of company data. We also discuss best practices when using tools like in-app dashboards, spreadsheets, SQL, and BI solutions. Behind these assertions are the principle that teams should be vigorously deliberate when organizing their sources and picking their toolkit. Keeping this in mind not only makes analysts effective at dealing with data early on, but also prepares them to reorganize their input streams into a data lake later on.
This stage is right if:
- Only a few people are going to be working with this dataset.
- Data needs are minimal at the moment
- Only a few small data sources exist
- The only people who need to make new visuals are fairly technical
It's time for the next stage if:
- Data is accessed from multiple places/applications
- There are needs for unique or combined charts/dashboards for cloud application sources like Salesforce
- A growing number of people need access to data
- There are performance issues
- Data is getting too big for a transactional database to operate efficiently
- Non-technical users need to create charts without help
Stage 2. Lake
Once companies must run analyses on multiple sources of data, each of which need joining, filtering, and manipulation, a company must move to a data lake. Blended data sources enable several actors in an organization to query a large subset of the company’s complete data. In turn, funneling various sources into a data lake supports database performance at a reasonably large (not necessarily “big data”) scale.
A central motivation for a data lake lies with the need for piping data to business intelligence tools. For example, when working with data from Salesforce, Hubspot, Jira, and Zendesk, each service has its own in-app dashboards and unique data APIs. Configuring input data streams for each business tool is a confusing, time-consuming, and unsustainable workflow. It cannot really be done, especially at scale. Likewise, performing in-house analyses across various sources can wildly complicate otherwise simple queries. On the other hand, having a data lake, which holds all relevant data in one place, allows analysts to use straightforward SQL queries to obtain business insights.
The central challenge faced by companies in the lake stage is knowing what toolset and methodology will unify and (safely) store your data. Companies looking to combine their data also run into performance issues, which we offer solutions to. And perhaps most important of all, choosing an architecture during lake development informs how easy (or hard) it will be for a company to build their future data warehouse.
This stage is right if:
- There's a need for unique or combined charts/dashboards for cloud application sources like Salesforce.
- A core set of people can learn the ins and outs of the structure of the messy data.
- You're intimidated by data modeling (don't be - that's why this book exists).
- There's no time for even light data modeling.
- Large datasets need performant queries.
It's time for the next stage if:
- More than a few people are going to be working with this dataset
- A clean source of truth would eliminate integrity issues
- There's a need to separate the structure of the data from the always-changing transactional sources
- There's a need to adopt DRY principles (Don't Repeat Yourself)
Stage 3. Warehouse (Single Source of Truth)
As more people begin to work with the data lake, questions begin to multiply: What data is where? Why? What particular criteria should queries use when looking for data insights? What do these schemata mean? Unavoidable complexities make it harder to obtain data, especially by less-technical colleagues. Even among in-house experts, more schemata and entities (i.e. tables and views) in turn cause more communication headaches. In time, the data lake serves all data but makes it harder to obtain the right data. It gets harder to write queries and share the knowledge within an organization.
All of these problems can be addressed with a clean and simplified version of the data, something we refer to as “a single source of truth.”
This stage—creating a data Warehouse—has historically been quite a nightmare, and there are many books written on how best to model data for analytical processing. But these days, there are more straightforward paradigms that have been tried and tested—and not only streamlines having to document the oddities found across an organization’s schemata but also saves time in having to repeat, edit, and maintain messy “boilerplate” query steps (e.g. “everytime you query the order’s table, make sure to adjust all orders from England to be in local time”).
In the data warehouse section of the book, we review how to clean data lakes, investigate standard practices for managing data complexity, and offer ways to establish an architecture with data integrity in mind. We provide modeling tool suggestions and an example SQL style guide. Finally, we give our recommendations for team structure, such as a lead to oversee this process and warehouse maintenance.
This stage is right if:
- ore than a few people are going to be working with data
- A clean source of truth would eliminate integrity issues
- There's a need to adopt consistent structure on top of the data lakes
- There's a need to adopt DRY principles (Don't Repeat Yourself)
It's time for the next stage if:
- The democratization of data would help others explore and understand data without help
- It's time to teach and enable business users to be more effective
- Projects exist that require different formats than what currently exists in the data lake
- Having truly informed employees is vital to your company's competitive success
Stage 4. Marts
Good news, your data is clean and the BI product speaks directly with tables in the warehouse. Using a tool like Tableau or Looker, non-analysts within the organization can self-serve their questions. By that, we mean they are empowered to engage with the data directly rather than needing to have an analyst build or run queries for them. This is excellent news: more people who use the data become increasingly informed, and everyone across the company can use data to their advantage.
But given enough time, hundreds of tables accumulate in a warehouse. Users become overwhelmed when trying to find relevant data. It’s also possible, depending on the team, department, or use case, that different people want to use the same data structured in different ways. So while the meanings of individual fields are unified, the abstractions used by different departments have diverged.
To sort through these challenges, we progress to the data mart stage. These are smaller, more specific sources of truth for a team or topic of investigation. For example, the Sales team may only need 12 or so tables from the central warehouse, while the marketing team may need 20 tables—some of them the same, but some different.
Just as a Warehouse Lead manages data warehouses, data marts benefit from being facilitated by Mart Leads. The Mart Lead helps educate and communicate subject matter expertise within the domain of each respective mart while supporting everyday maintenance tasks. Not only will further simplification of data into local marts improve usability, but the integrity of data also becomes easier to maintain. After all, the responsibility of maintenance distributes to Mart Leads rather than centralized to a single person. The organization which leverages data marts effectively is an example of intra-company data literacy in action.
This stage is right if:
- The democratization of data would help others explore and understand data without help
- It's time to teach and enable business users to be more effective
- Projects exist that require different formats than what currently exists in the data lake
- Having truly informed employees is vital to your company's competitive success
It's time for the next stage if:
- The data mart stage is the final stage. There can be any number of marts, and there can be multiple levels of marts if needed. After implementing this stage, data arrives in a complete, well-architected, and governed stack that continually evolves to support an informed and competitive company.